I’ve often said that it’s pretty easy to manage a small VDI environment, but things change when you start scaling above a few hundred desktops. The amount of work and complexity of the environment changes, you are now dealing with a complex infrastructure stack to supply resources to the desktops. Above the hardware, you now have a large number of user sessions to support.
To help with the task of managing this type of environment, admins need some type of tool set. Currently the choices to manage VDI environments is pretty limited. If you are a VMware Horizon View customer, the leading tool choice would be VMware vCenter Operations Manager (vCOPs) for Horizon View. I have put together a detailed walkthrough on what you can expect to get out of the tool in this post.
(Note: The screen shots are big pictures that I had to shrink down, but I wanted to illustrate all the data points that you are able to see. You can see the full size image by clicking on each image.)
VMware vCenter Operations Manager for Horizon View Dashboard
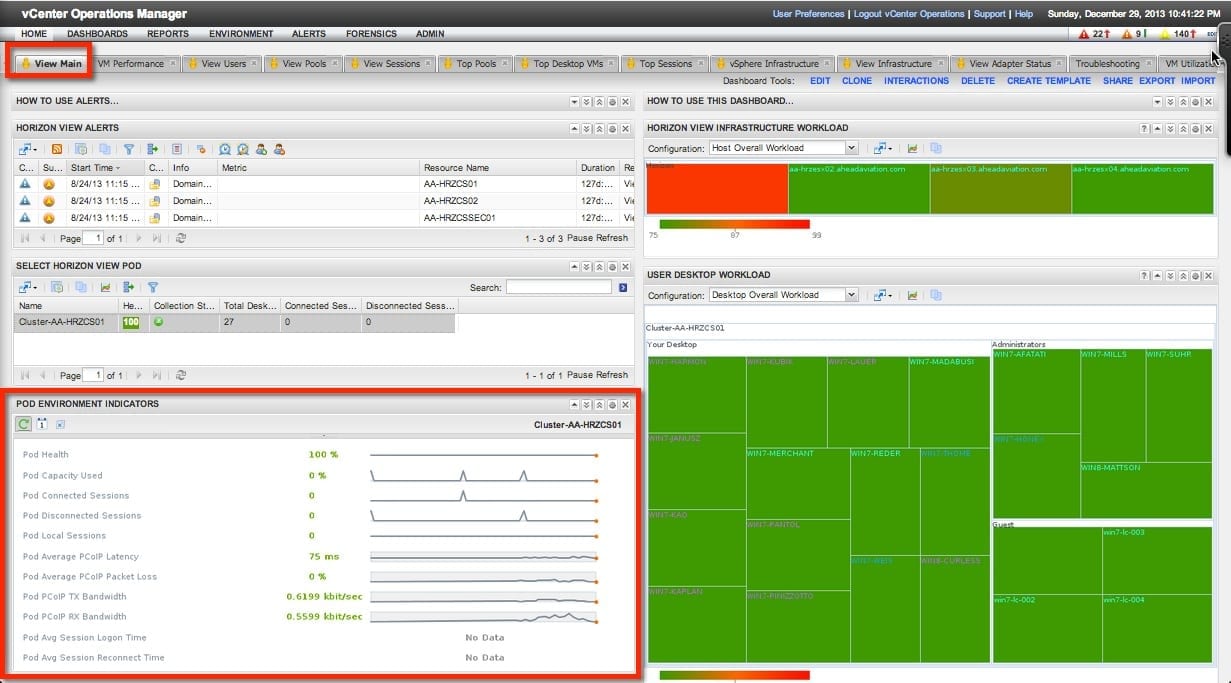
Upon logging into vCOPs for Horizon View you will be greeted with the dashboard. From here you can get a high-level view of how your environment is performing. There are sections that show you the following data.
- Horizon View alerts – Error alerts for different parts of the environment
- Infrastructure workload – Get visibility on how hosts and other parts are performing
- Horizon View Pod – A high-level summary of how each View pod is performing
- User Desktop Workload – Get a stoplight view of how desktops are working
In the image below I have highlighted the View Pod section. I really like these details. From this panel I can see how my View pod is running. I get access to details that show the average latency of sessions, number of sessions, pod health, number of sessions, and the PCoIP bandwidth being used.
This type of high-level reporting can be very helpful to admins supporting VMware Horizon View installs. From this dashboard they can quickly verify that things are going smoothly or identify items (shown in red) as issues and being to investigate what the issue might be.
View VM Performance
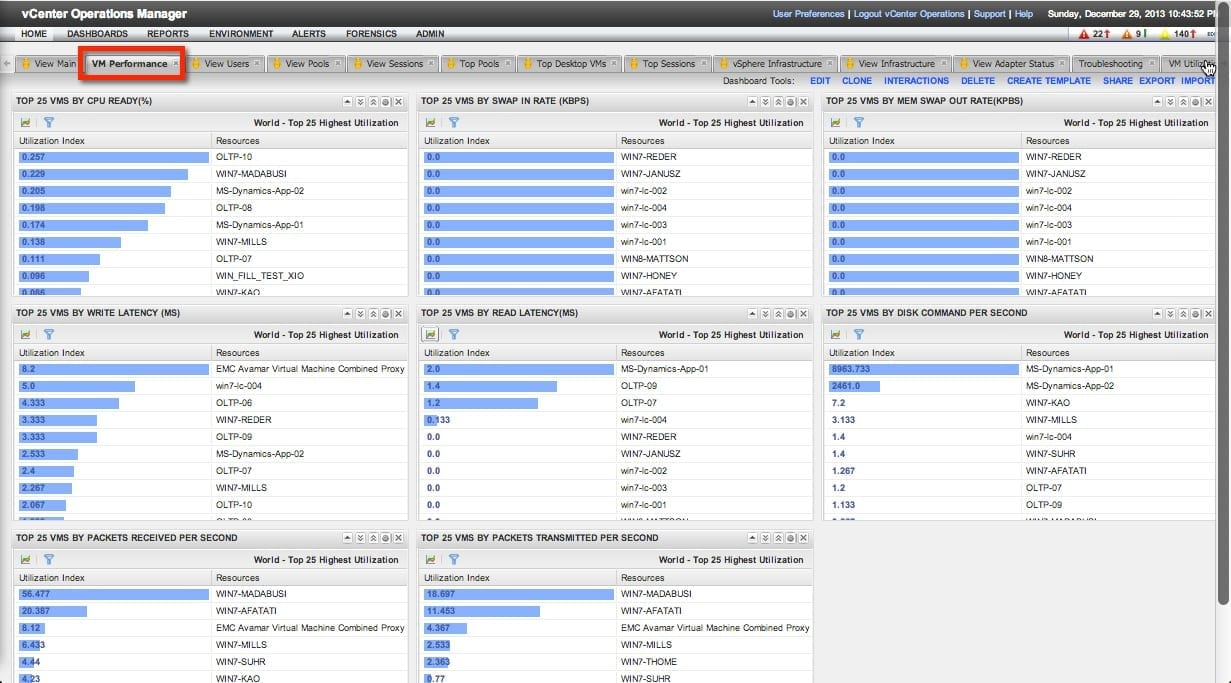
As we look through each of these more specialized dashboards you will notice that vCOPs has a ton of data points for you to view. The next section up is the VM Performance tab. From here we get a look at the VMs managed by the vCenter that is connected. For my lab install this includes all of my View desktops and a few server VMs.
The dashboard is broken down into eight blocks showing us some popular data points. This data is very valuable to admins and presenting it in this manner makes it easy to consume. I have listed the views below and a few notes on why I think they are important. Each data point is shown the top 25 VMs for the selected metric.
- VMs by CPU Ready (%) – You can get an idea of how your CPU ratio (scheduling) is performing. Helpful in managing performance and VM density
- VMs by swap in rate – Find out if you are having any swap issues
- VMs by mem swap out rate – Find out if you are having any swap issues
- VMs by write latency – This is helpful in identifying if you are having any storage performance issues related to disk writes
- VMs by read latency – This is helpful in identifying if you are having any storage performance issues related to disk reads
- VMs by disk commands (IOPS) – See which VMs are generating the highest number of IOPS. This allows you to see if there is a trend (or just a few users) that is doing something out of the norm.
- VMs by packets received – A view of how much data is being received at the network level
- VMs by packets transmitted – A view of how much data is being transmitted at the network level
View User Statistics
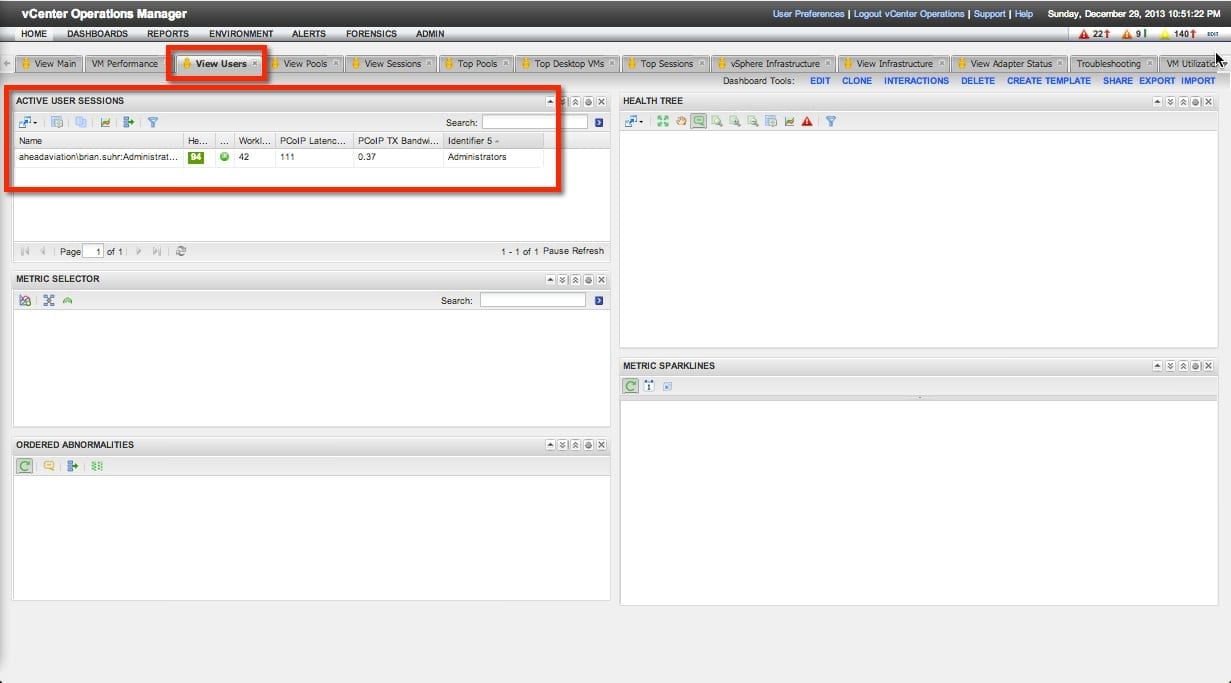
On the next tab we can get a view on users. Since this is a lab, the only session open when I was writing this was my test session. But the image below gives an idea of what type of data is presented. I’ve highlighted the active user session area, as it provides some great details on my session.
I can easily see what the workload rating for my session is, the PCoIP latency, and the amount of bandwidth the session is using. These are valuable statistics for admins looking to easily see how a session might be performing.
View Pool Statistics
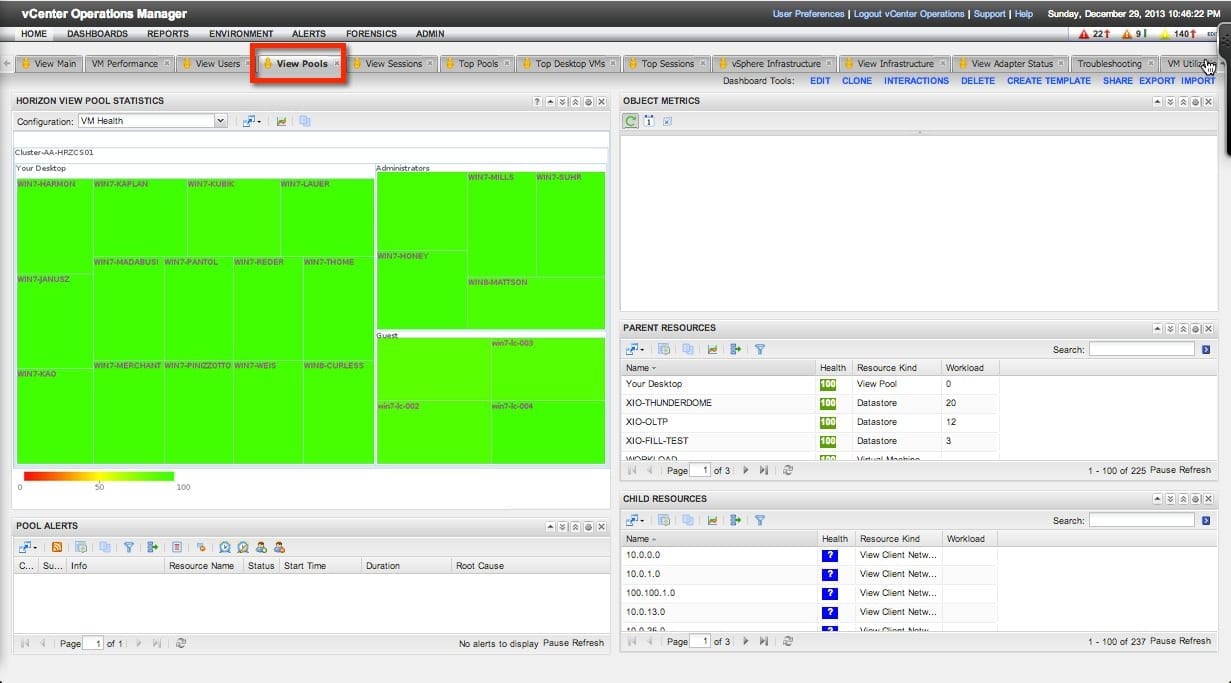
On this tab we get a representation of how each of our view pools are performing. This is done via the stoplight method using blocks that represent our desktops and use a green, yellow, or red color to show their health. The view pools of desktops are grouped on this page, and we can easily see how desktops within each pool are performing.
This is an easy way to identify any users desktops that might not be performing well. This could be used in a proactive manor or in response to a user complaint. Either way it makes the job of finding under performing desktops pretty simple.
View Session Statistics
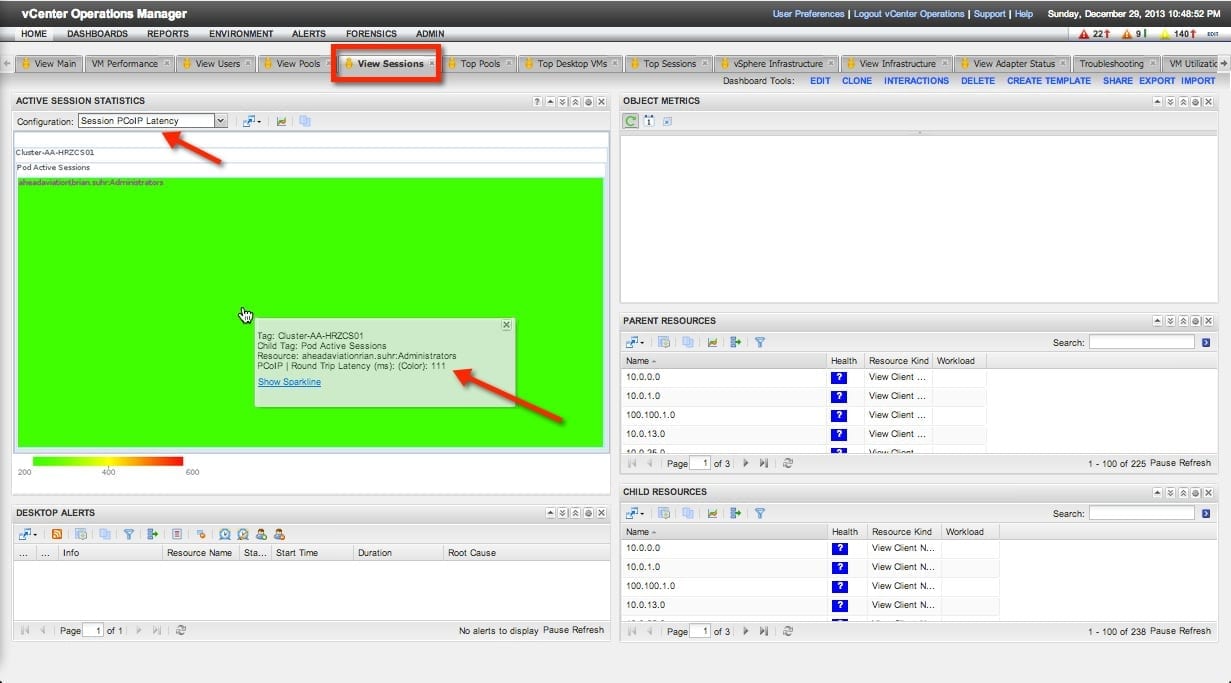
Much like the previous pool view and user stats, this view shows us the same view or View user sessions. In the sample below you can see my test session that is shown in green for the chosen metric. You are able to choose from a list of metrics that you want to represent for the sessions. In this sample shown below, I’m looking a PCoIP session latency and my session has 111ms, which is still within the green rating. There is a sample legend just below the rating that shows what values would trigger a green, yellow, or red color.
Top Desktop VMs
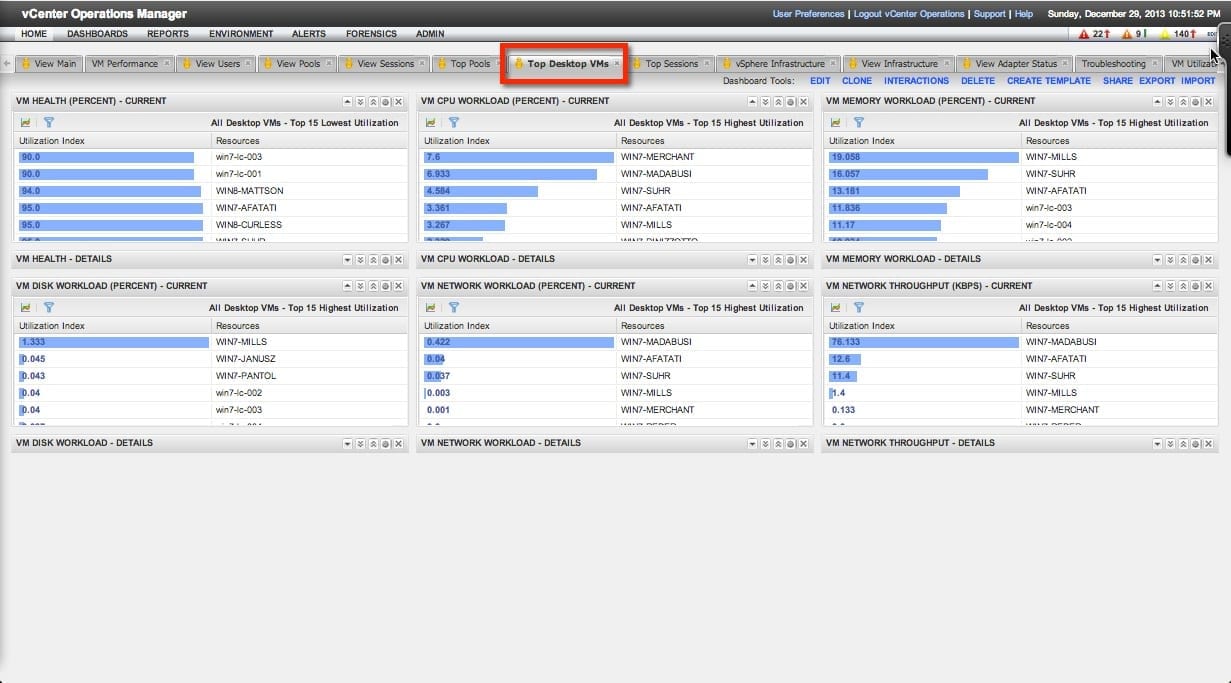
This dashboard gives you a view into how different VMs are performing for some of the topic metrics. Each view is showing the top 15 or so VMs for the selected value. These views are highlighting VM health, CPU use, network use, and memory usage. This helps paint a picture of which VMs are consuming the most resources. This should help with identifying any VMs that stick out or just a view into what the average values are for your install.
Top View Sessions
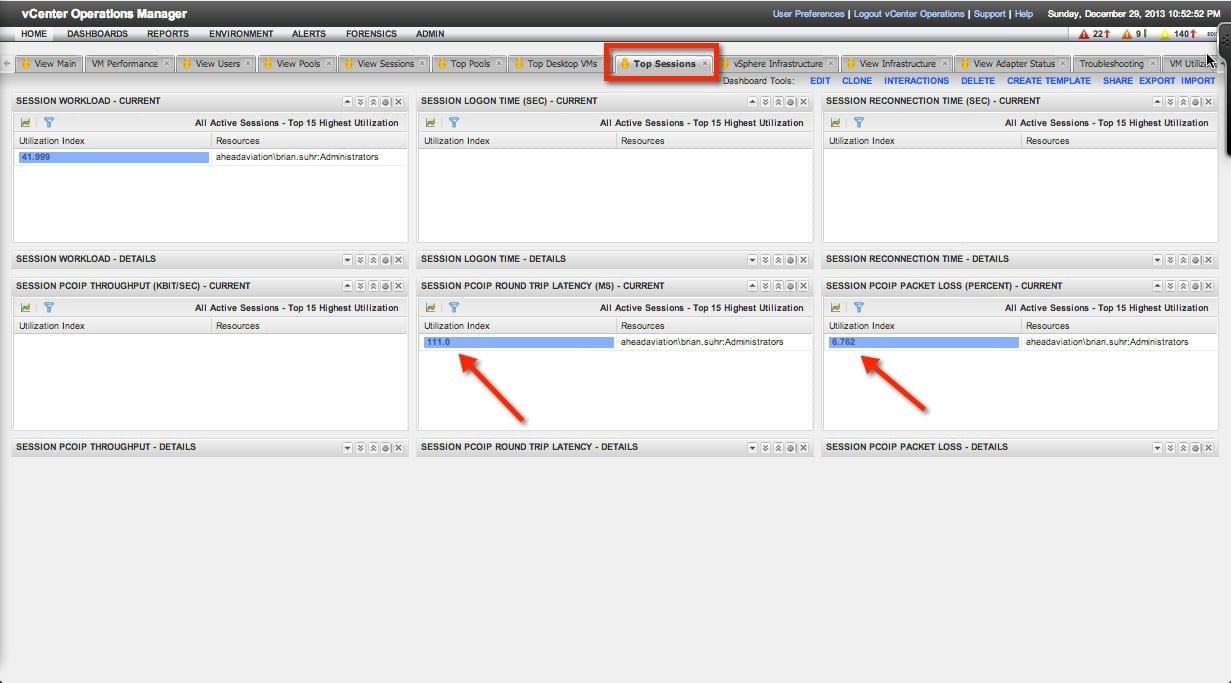
From this dashboard we can get an idea of which user sessions are ranking in the top 15 for each metric. These views show us important statistics for latency, logon times, and PCoIP traffic.
vSphere Infrastructure Performance
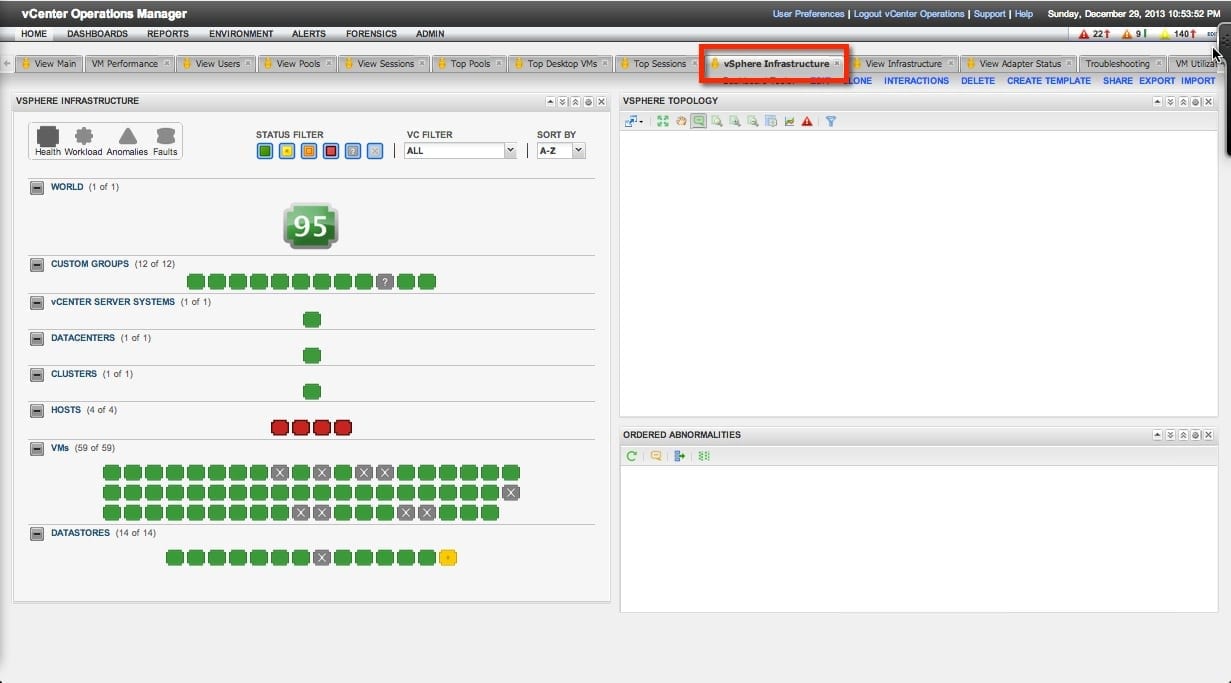
The previous sections have heavily focused on users sessions and desktop VMs. Under all that is the vSphere infrastructure that everything is running on, so we need to monitor this in the same way. This dashboard gives use the traditional vCOPs look into how our vCenter and vSphere resources are performing.
From here we can see, for example, if a particular host or datastore is being worked harder than others. We can then take action to mitigate the issue or find the root cause into why the work is not being evenly distributed.
View Infrastructure Performance
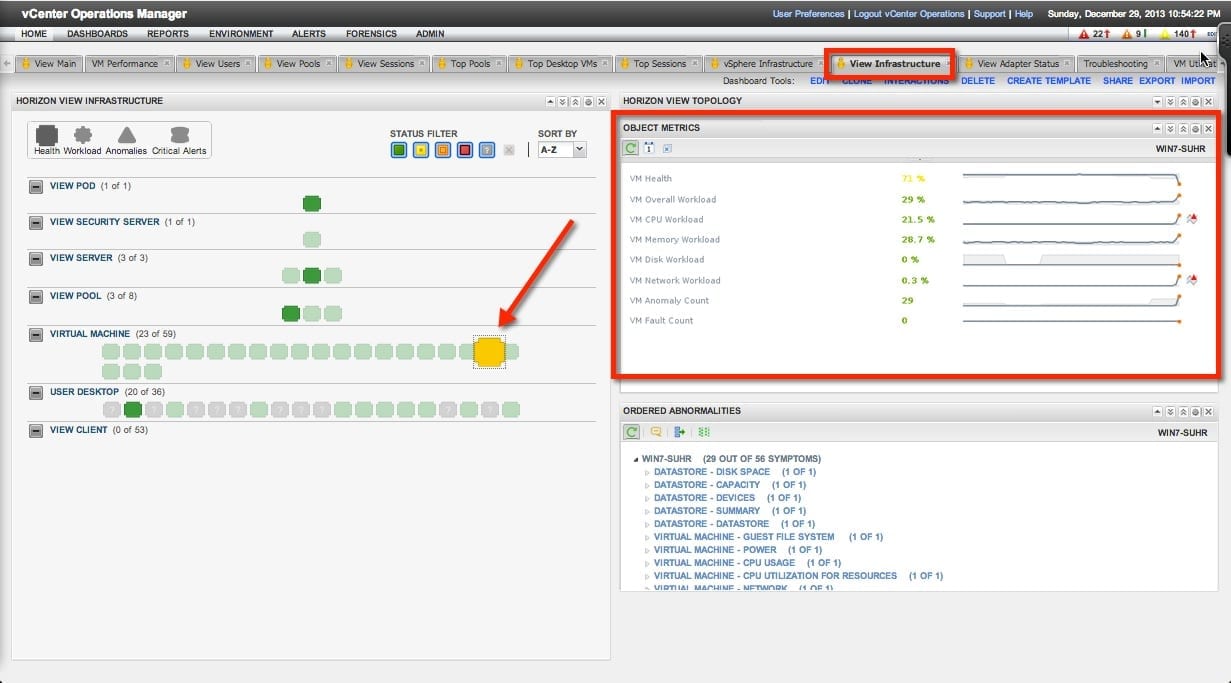
Similar to the previous vSphere section, this dashboard gives us a look at the Horizon View infrastructure items. On this dashboard we can see how our Horizon View servers, security servers, pods, etc. are performing. In my example below I have highlighted a single desktop that is rated yellow and the panel on the right is showing specific details about the desktop.
View VM Utilization
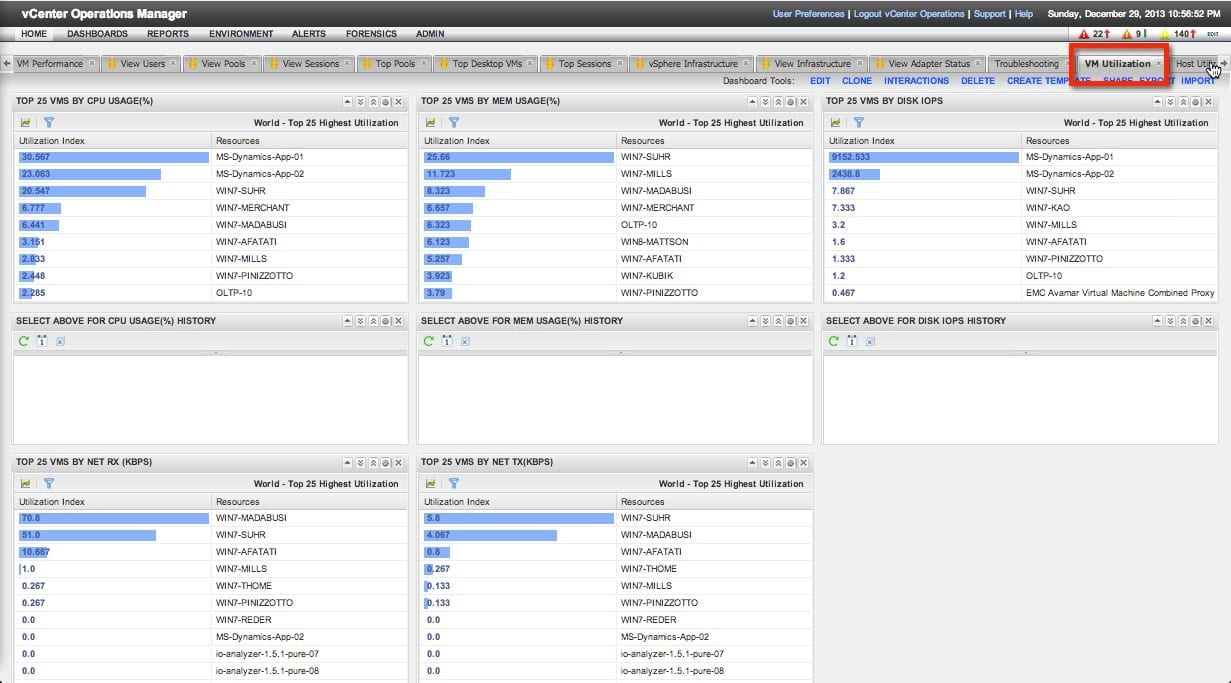
Last up here is another dashboard that shows us the top 25 VMs for each of the metrics listed. Another helpful way to see who is working the hardest or consuming the most resources. These can help you collect data on your install to report to management or use for scaling the environment for expected growth.


