


Using Microsoft Azure Resource Explorer to Debug VM Deployment Errors

In today’s Ask the Admin, I’ll show you how to use Azure’s Resource Explorer to debug errors when deploying ARM-based virtual machines using PowerShell.
One of the biggest frustrations of using PowerShell to deploy VMs in Azure is the lack of information in error messages. This is a frequent compliant of Unix administrators when they start dabbling in Windows — not only are error messages somewhat cryptic, but often don’t contain enough information to solve the problem.
I’ve recently been updating my Azure PowerShell scripts to work with the new Resource Manager deployment model, and although there’s a lot more flexibility when compared to classic mode deployment, the code needed to put all the necessary resources into place is more complicated than what was previously required.
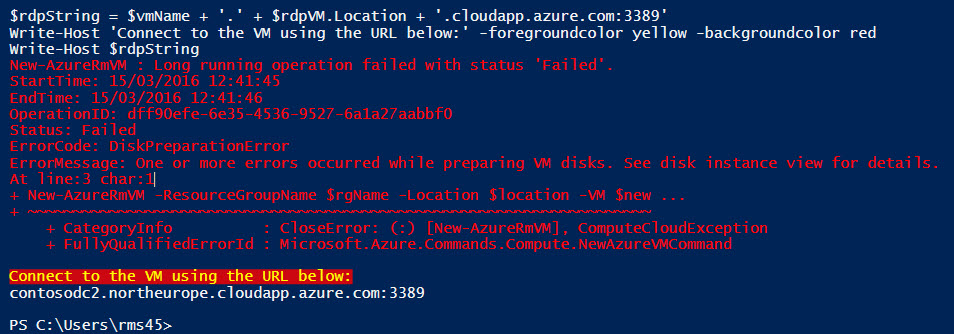
As part of the process, I’ve naturally had to debug some issues. Most of which were due to ‘human error’ in the script syntax that could be easily corrected. However, I did come across a problem deploying a new VM to a storage account that was already in use, receiving an error from the New-AzureRmVm cmdlet: Long running operating failed with status ‘Failed.’ Not incredibly useful. Some more information was included however:
ErrorCode: DiskPreperationError ErrorMessage: One or more errors occurred while preparing VM disks. See disk instance view for details.
There are some key points to understand here. This error doesn’t occur if the storage account is new — only when a second VM is deployed to the storage account. And from the PowerShell error messages, we can confirm that the problem is disk related. But most intriguing is ‘See disk instance view for details.’ Instance view in Resource Manager can be viewed using Resource Explorer, a web-based tool that allows you to explorer Azure resources.
Azure Resource Explorer
While I’d prefer PowerShell to report all the error information in one place without me having to go searching for it, that’s not the case, with Instance view displaying more detailed information about deployment errors.
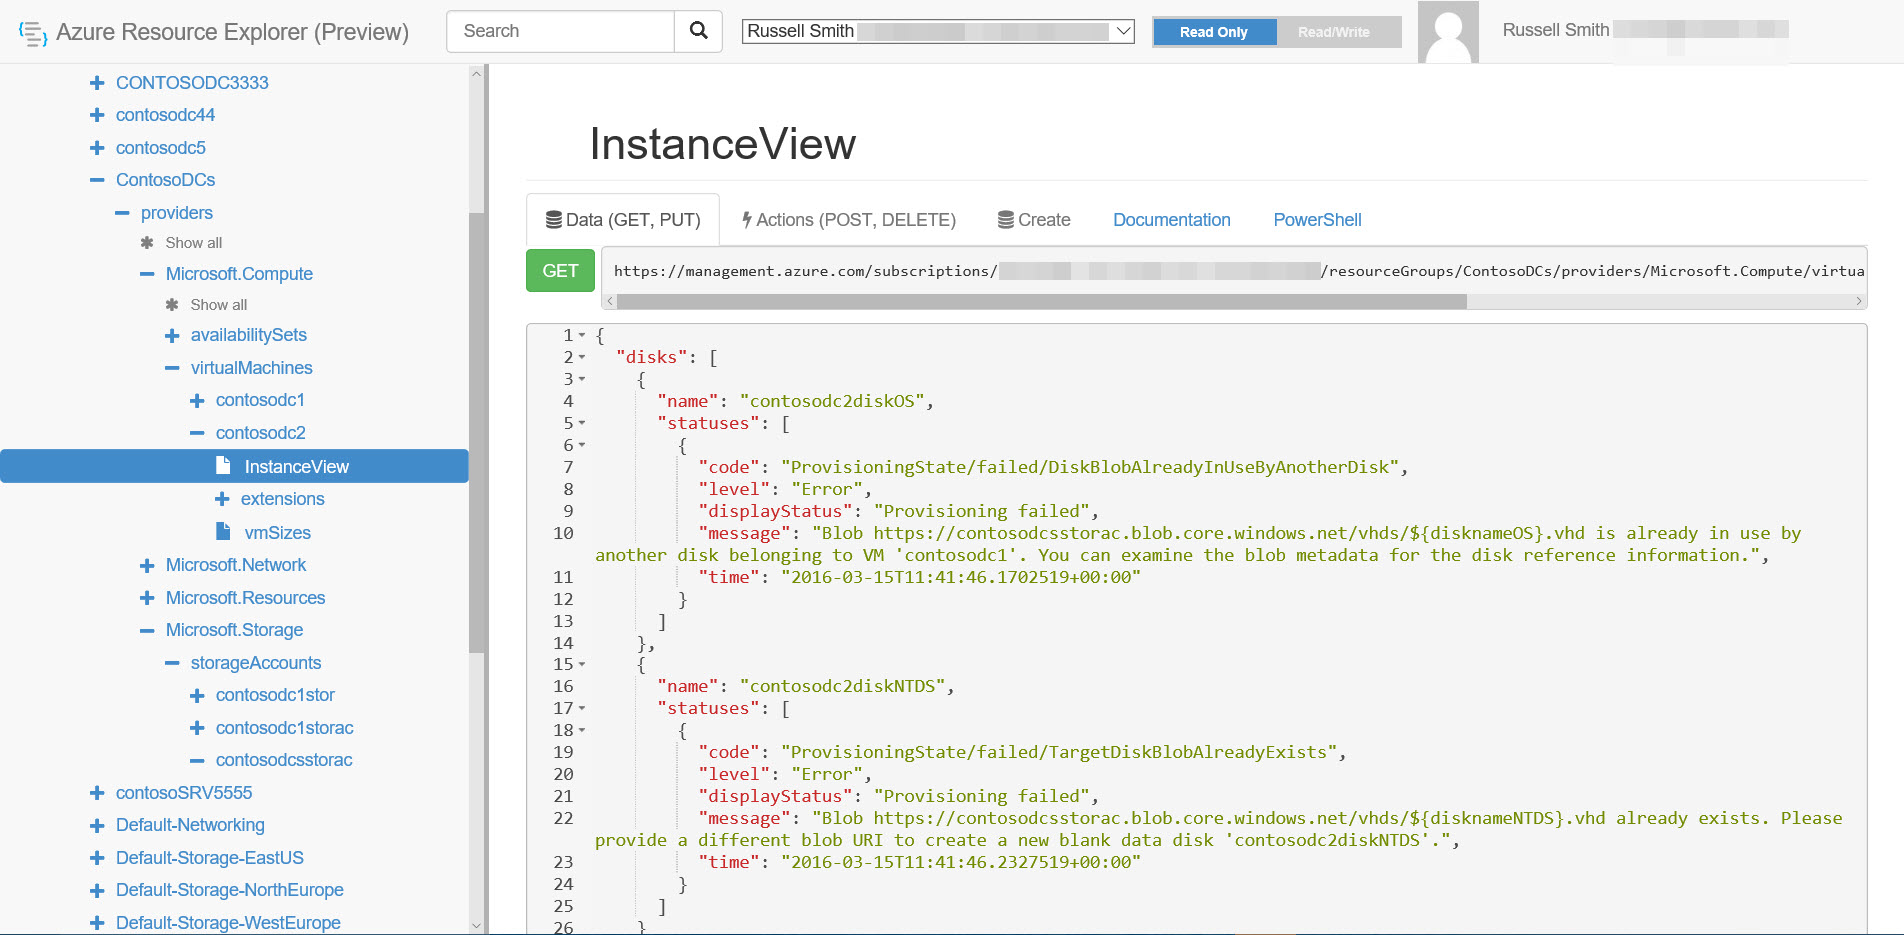
To access Resource Explorer, open resources.azure.com in a browser window. If you’re not already signed into your Azure subscription, you’ll be prompted to do so. Resource Explorer opens in Read only mode, so you can’t accidently modify your resource configurations.
- In the left pane of Resource Explorer, expand subscriptions.
- Expand the subscription you want to explore.
- Expand resourceGroups, then the Resource Group (RG) that you want to explore.
- Next Microsoft.Compute and virtualMachines.
- Finally, click the VM that you want to explore, and then InstanceView.
In the right pane, scroll down the Data (GET, PUT) tab and look for any status messages that indicate a deployment failure. In my case, the detailed status message clearly indicates that the .VHD specified for the VM is already in use, so I was able to go back to the script and found a mistake that I’d missed, leading to the .VHD file being created with the same name each time the script is run.