Using the SharePoint 2013 Developer Dashboard
- Blog
- SharePoint
- Post
Troubleshooting SharePoint 2013 problems can be a complex issue, with SharePoint logging taking place in both the Windows Event Logs and the SharePoint Unified Logging Service (ULS) log files. To make it more complicated, there are a lot of options for customizing the ULS logs, so you may not yet even have the items that you’re looking for being saved in the trace logs.
Thankfully, there are a lot of options to view the ULS logs. You can use the ULSViewer utility, the Usage and Health Monitoring service database, and in some cases you can even turn on the developer dashboard to enable the viewing of ULS logs that are related to your current web requests in real time as they happen.
Today I’ll introduce you to the SharePoint 2013 developer dashboard and how to enable (or disable) it in your SharePoint farms.
What Is the SharePoint Developer Dashboard?
It helps you troubleshoot errors in your environment by displaying all of the information about your current SharePoint web requests. It includes the web addresses of the SharePoint sites you’re visiting, the results of those web requests, and even the ULS logging entries created that are related to your activities.
In terms of the ULS log entries, you’ll get to quickly view all ULS entries that are related to your current web requests, regardless of what server those entries actually live on. Since ULS logs are kept on each server in your farm, but each server keeps only the entries that are created by that server, having the overall view of the ULS entries that are related to the actions you’re performing is a really handy benefit.
Enabling SharePoint Developer Dashboard
You don’t have to download anything or install the developer dashboard in SharePoint 2013. However, it’s not enabled by default. The only way to turn on the developer dashboard is to use some of the .NET objects for SharePoint. PowerShell makes this manageable and actually pretty easy.
First, load the SharePoint Web Services content service object, and save it into a variable:
$SPContentSvc = [Microsoft.SharePoint.Administration.SPWebService]::ContentService
This makes a reference to the Microsoft.SharePoint.Administration.SPWebService class and calls on the static property of the object called ContentService. The double colon enables us to tap into the properties and methods of the class.
Once it’s saved into that variable, it becomes easier to work with. We can locate all of the developer dashboard settings in a collection of properties within the Content Service. We can make working with the developer dashboard settings easier to work with by saving them into a new variable as well.
$DashboardSettings = $SPContentSvc.DeveloperDashboardSettings
Now we can find the current settings of the developer dashboard very simply.
$DashboardSettings.DisplayLevel
And we can change them very easily, too.
$DashboardSettings.DisplayLevel = "On"
$DashboardSettings.Update()
Do I Have to Turn On Developer Dashboard For Every Site/Site Collection?
This is one of the downsides of the developer dashboard. If you enable it, you’re enabling it for the farm. It’s not selective, you get the whole enchilada. For this reason, it might make the most sense to use it only, or at least more often, in development or test farms. Then you can leave it turned off in production farms.
On the other hand, your production farm is sure to get the most use, and you may be trying to troubleshoot an issue for a user that only seems to present itself in the production environment.
No matter what you choose to do, you’ll want to be able to quickly and easily turn on the developer dashboard for your SharePoint 2013 environment, and you’ll also want to be able to turn it off when you don’t need it.
Viewing ULS Logs with Developer Dashboard
Oh, right! This article isn’t just about turning on the developer dashboard, but actually using the developer dashboard to view ULS logs.
Well, now that it’s turned on you’ll find it really easy.
- Login to your SharePoint site.
- Click the Developer Dashboard icon on the far right side of the tab section of the ribbon.
This will pop up the Developer Dashboard in a separate browser window.
- Browse to the SharePoint site that you’re having trouble with. Notice that as you browse, the developer dashboard begins logging the session requests.
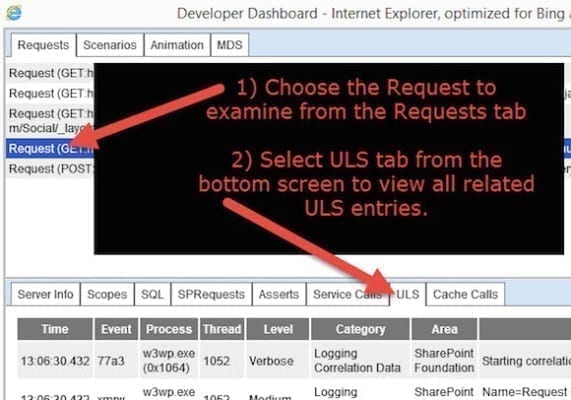
- Select the request for which you want to inspect the logs. Then select the ULS tab from the bottom pane. This will parse through the logs to show all entries from the ULS logs related to your request.
Turning off SharePoint Developer Dashboard
All you’ve got to do to turn off the developer dashboard is to again modify the DisplayLevel property of the DashboardSettings variable and update it.
$DashboardSettings.DisplayLevel = "Off"
$DashboardSettings.Update()
Now that you’ve got your developer dashboard turned off, you’re right back to where you started. The icon is no longer on the ribbon, and even if the developer dashboard browser window is still open, it will no longer get updates when you browse the SharePoint site.


