

Getting Started with Power BI and SharePoint Online — Part 2

In the first part, we looked at Getting Started with Power BI, connecting to your SharePoint data, and making a beautiful visual with that data. If you have not already, read that article on Petri.com. I promise to be here waiting when you get done. Done? Cool. With that out of the way, we are going to dive into publishing that visual to Power BI, configuring the SharePoint data refresh, and displaying your work of art on your SharePoint page using the Power BI Web Part. I promise this will be amazing.
Publish to Power BI
Before you can consume this awesome visualization in your SharePoint online site, you need to publish this to Power BI. We will publish and look at a couple of settings for refreshing your data. Who is excited?
To start, click on Publish in the Ribbon. You will be prompted for a destination. To make it easy, choose My workspace and click Select. Once we get logged into the Power BI website, we will look at how you could have created other dashboards to publish to.
Wait 15 seconds or so. After you get Success!, (their exclamation mark, not mine) click on the link underneath it, Open ‘Your File.pbix’ in Power BI. If you are prompted, sign in with your same account.
This will open a browser window with your beautiful visualization looking back at you. Cool. Now that it is online, let’s adjust some of the settings.
On the left, click on My Workspace. Not much going on yet here because you do not have a dashboard. This is a topic for another day. If you click on Reports, you will see the Report you published. Then, click on Datasets.
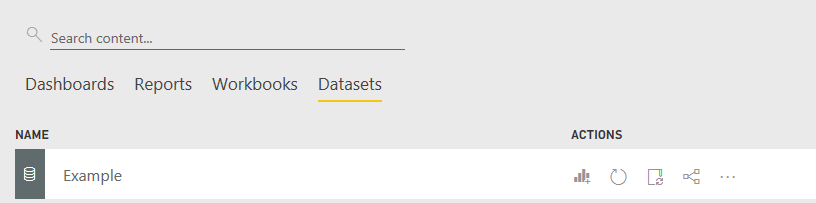
Here, you can see an automatically created dataset. This is the connection to your SharePoint online list. How nice. You could use the circle symbol thing to Refresh your data. However, you are not a robot. You do not want to come in here every day and refresh the data. So, let’s setup automatic refreshes.
Click the ellipse to right of the refresh symbol and from the menu, select Settings. Now, expand the option for Scheduled refresh and turn it on. Check out the options and click Apply.
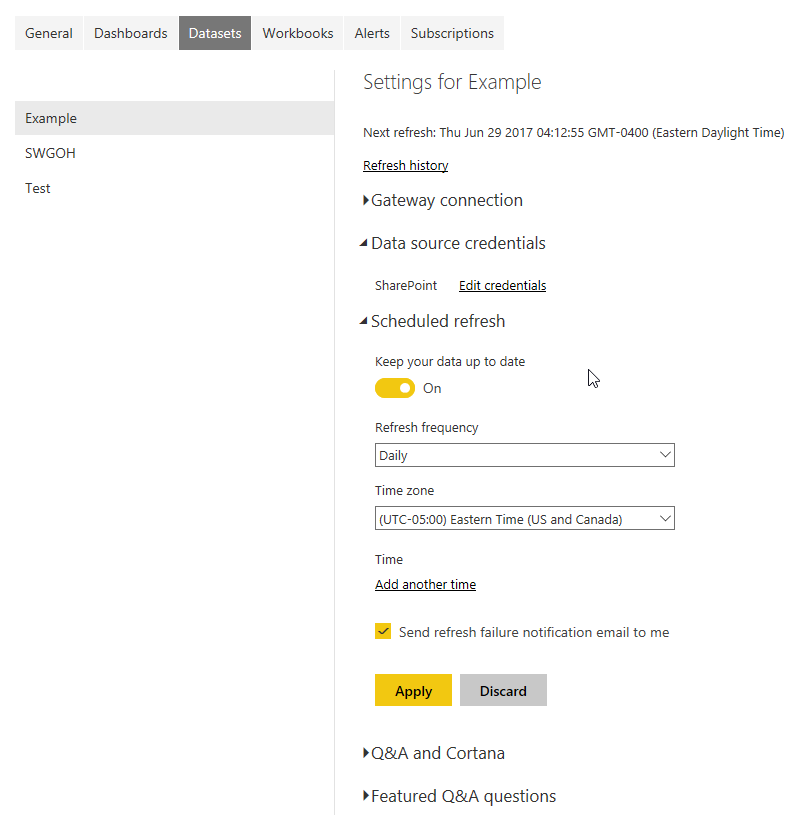
You will also need to setup your credentials so that Power BI can connect to the data. To do so, expand the Data source credentials section and click Edit credentials. From the dropdown, change your authentication method to OAuth2 and click Sign in. Now, put in the information for whichever account you want to refresh the data using. I will skip the debate about service accounts and such.
Boom! Now, you have your Power BI report published and refreshing data daily. Pretty cool. All that is left is to start consuming it on your SharePoint Online site. Onward to the final section!
Display Power BI in SharePoint Online
This is the easiest part, which was not always the case. The first time I tried to do this, it was borderline impossible. Thankfully, they gave us a web part that we can use without any mess or fuss. Well, maybe a little fuss since the web part is available on Modern Pages.
Before you head over to your SharePoint site, you need to grab the link to your report. Click on My Workspace on the left again and click Reports. Now, click on your Report’s name to open it up. At the top of your page, click on File and from the dropdown, select Embed in SharePoint Online (Preview).
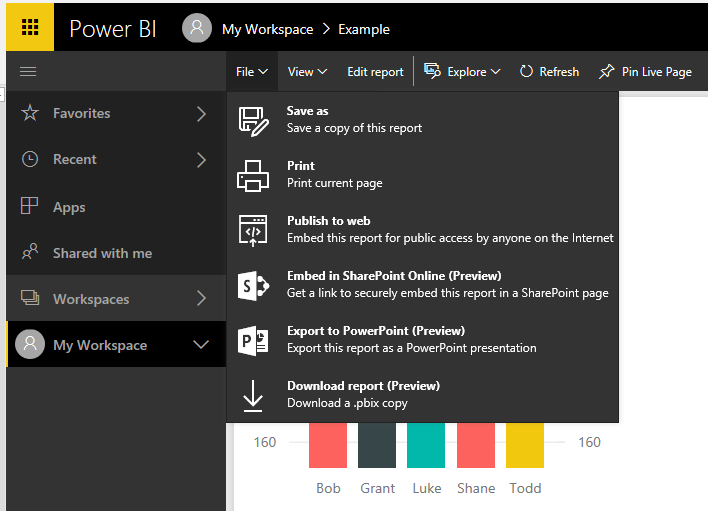
A window will open with a URL. Copy that URL down (hopefully by pressing CTRL+C and not by writing it on your hand) and click Close.
In a different browser tab, open your SharePoint site to the page you want to add the Power BI web part. Remember, the page has to be a Modern Page. If you are still using the Classic SharePoint UI, then these instructions will not make sense or work and the web part is not available. Having said that, I probably would not change your site to Modern UI without some consideration of the greater impact.
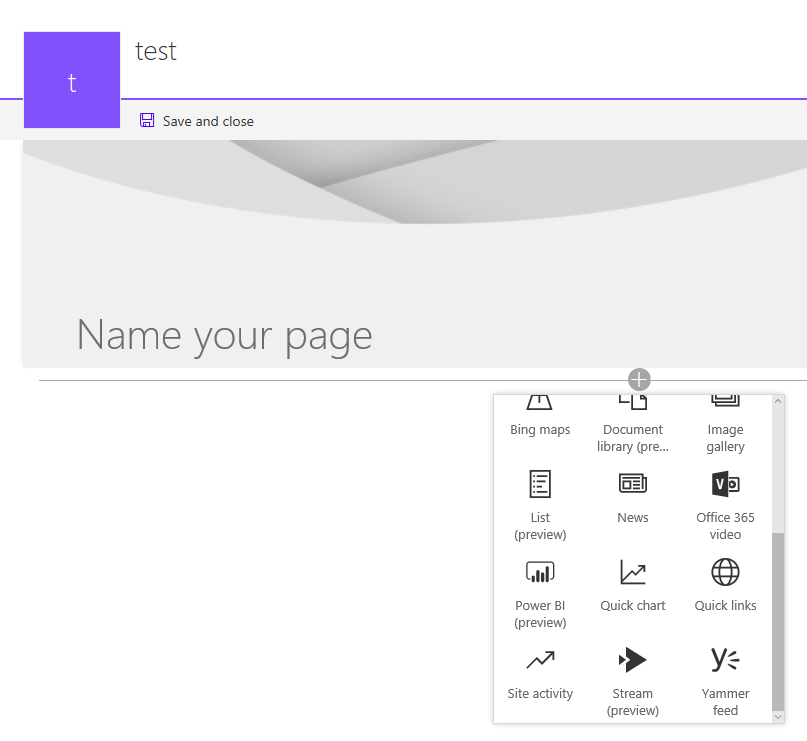
On the SharePoint site, click the little gear thingy and from the dropdown, select Add a page. Give your page a name and click the plus symbol to add a web part. Scroll down and find the Power BI (preview) web part and click it.
Now, click the pretty purple button that says Add report. In the pane on the right, paste in your link. You copied in the box that says, “Paste the report link here.” And then, click Publish.
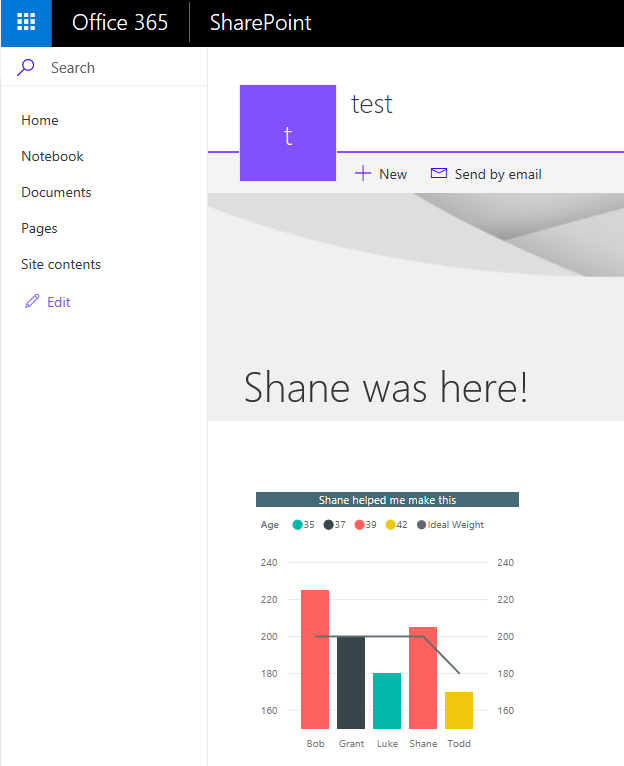
That does is it. You now have your SharePoint list data visualized through a fancy Power BI Report. So cool. Obviously, there is some tweaking and sizing you need to do to get optimal beauty but you now are equipped with all of the pieces of the puzzle. Go forth and make Power BI and SharePoint Online magic!
If you want to watch all of this in glorious video form, check out Getting Started with Power BI and SharePoint Video. And as always, if you have any questions or need help, feel free to hit me up in the comments below or tweet me at @ShanesCows.